Dashboard
The dashboard is the "home" of the active space — the landing screen at /. It brings together two things: activity (what changed and when) and an overview of the knowledge base (what's actually in it). For a completely empty space (0 notes), the dashboard steps aside and shows an invitation to create your first note — nobody needs a grid of zeros.
At the top sit three switcher tiles. Each carries an icon, a name, and a short metric, and clicking one takes you to a dedicated surface with full lists. The tiles are always visible, and the active one is highlighted in an accent color.
| Tile | Metric | Surface |
|---|---|---|
| Activity | N changes this week | the feed and heatmap |
| Projects | total · active in window | project ranking |
| Hygiene | how many "need repair" | connectivity repair queue |
Below the tiles is a thin summary line notes · tags · links; "links" is clickable and leads to the graph.
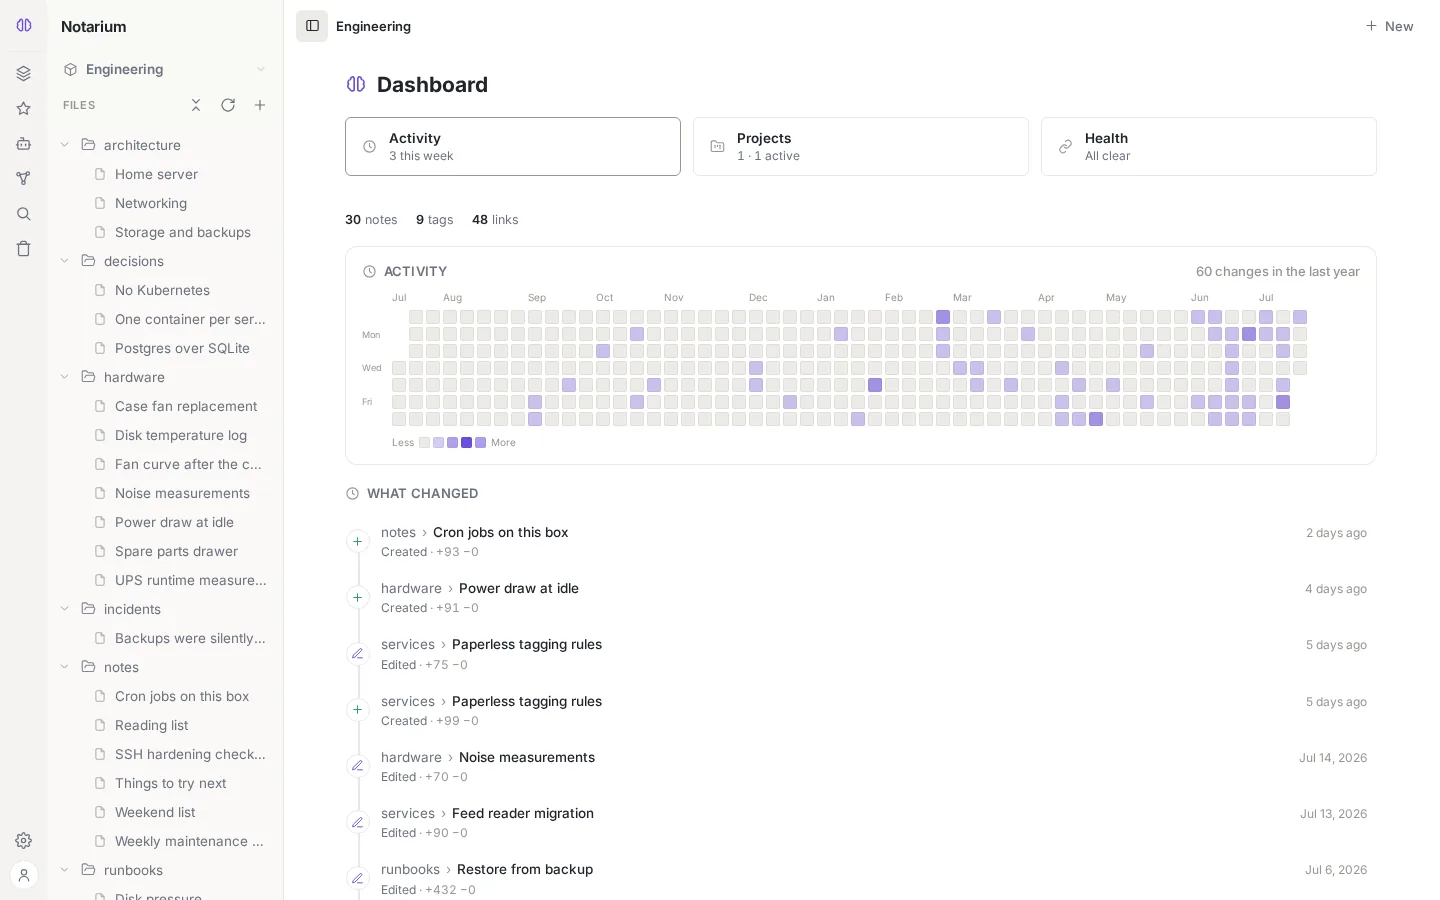
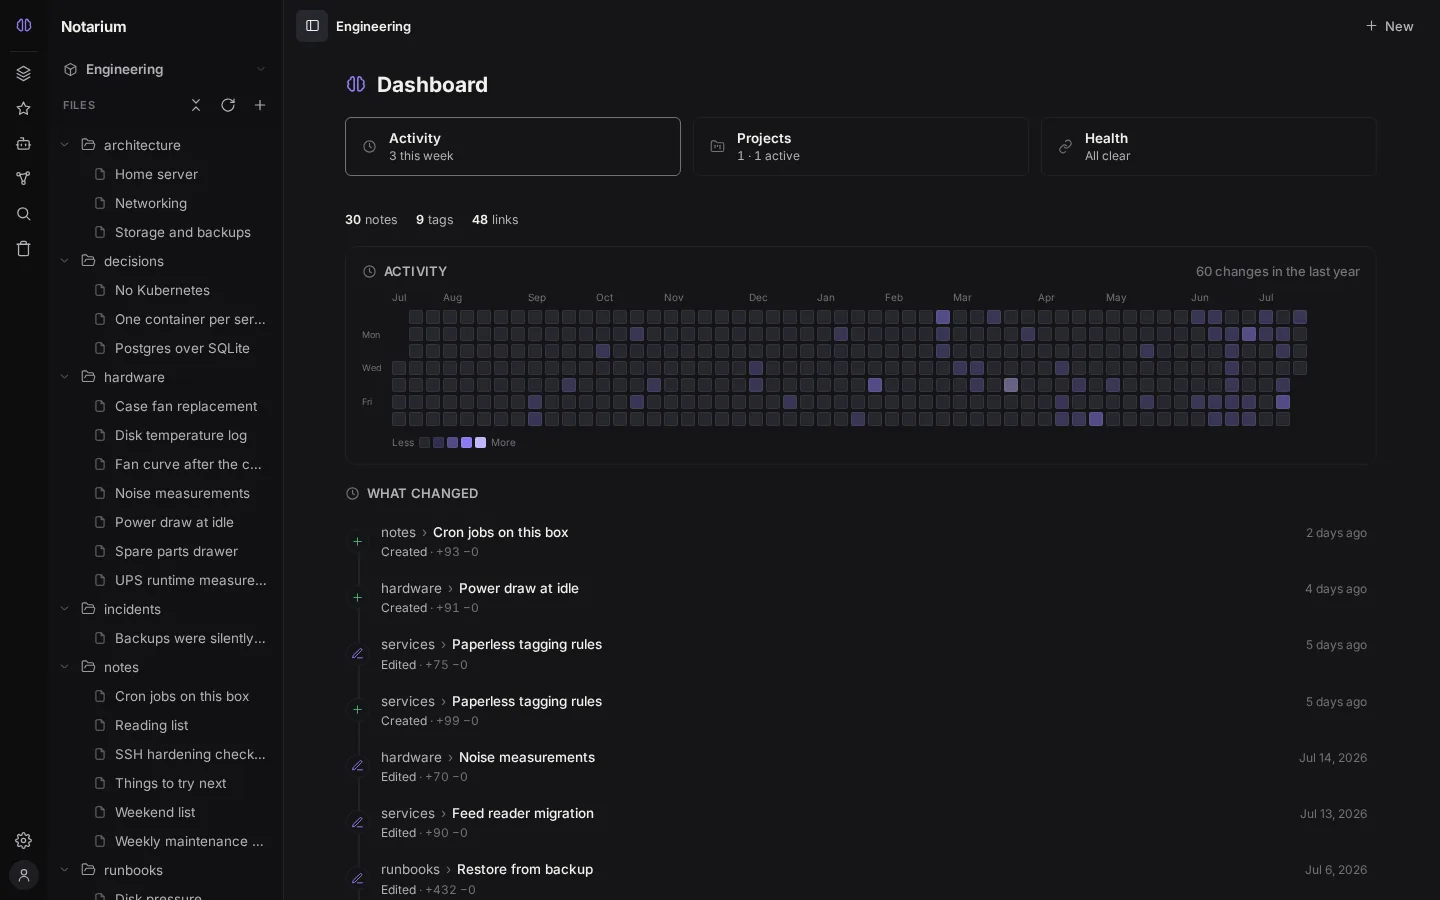
Activity
The "Activity" surface is a contribution-graph-style heatmap plus a "what changed" feed.
Cells reflect edits that went through Notarium, not the source dates of the files. A freshly mounted or just-imported space is empty until people start editing it; an import produces a spike on the day of the import. The rest of the dashboard (stats, projects, hygiene) is always populated — it comes from the index, not from the log.
- Heatmap — a grid of weeks over a rolling year (53 weeks up to today). A day's intensity is its number of events, on a 0–4 scale relative to the busiest day in the window. A day is counted in your time zone. Clicking a day expands the event feed for that specific day.
- The "what changed" feed — a timeline: the location (breadcrumb
Folder › Subfolder › Title, each segment a link) and the title with the time on top, the metadataaction · ±size · authorbelow. The author is shown only if it isn't you — in a personal space the line stays clean.
Activity counts note creation, edits (including external ones and restores), and deletion. If a space contains edits by others, an Everyone / Mine toggle appears — a lens for "whose activity am I looking at"; the toggle applies to everything at once — the heatmap, the feed, and the day's expanded events.
Projects
The "Projects" surface is a full ranking of projects by activity over the window (about 90 days by default): "where the work is happening / where to pick up." A row shows the project name, the time of its last activity, and a counter; clicking it leads to the project folder. A note counts toward the deepest project that contains it, so a nested project doesn't inflate the root one.
Hygiene
The "Hygiene" surface is a connectivity repair queue. Three sections (read-only), each hidden when empty; a healthy graph shows "everything's connected":
- Broken links — targets that didn't resolve (
[[Label]]pointing nowhere) and who links to them, sorted by the number of linking notes. Clicking leads to the first source. - Resolved via former name — links that keep working through old names thanks to aliases: renaming a target doesn't break incoming
[[Old name]]. Handy to find and update if you want things tidy. - Orphans — graph nodes without a single link: "what's cut off" from the rest of the knowledge base.
The dashboard is live: data rides the shared change stream (SSE), so it updates without a manual page reload. For how the link graph itself works, see Knowledge graph.